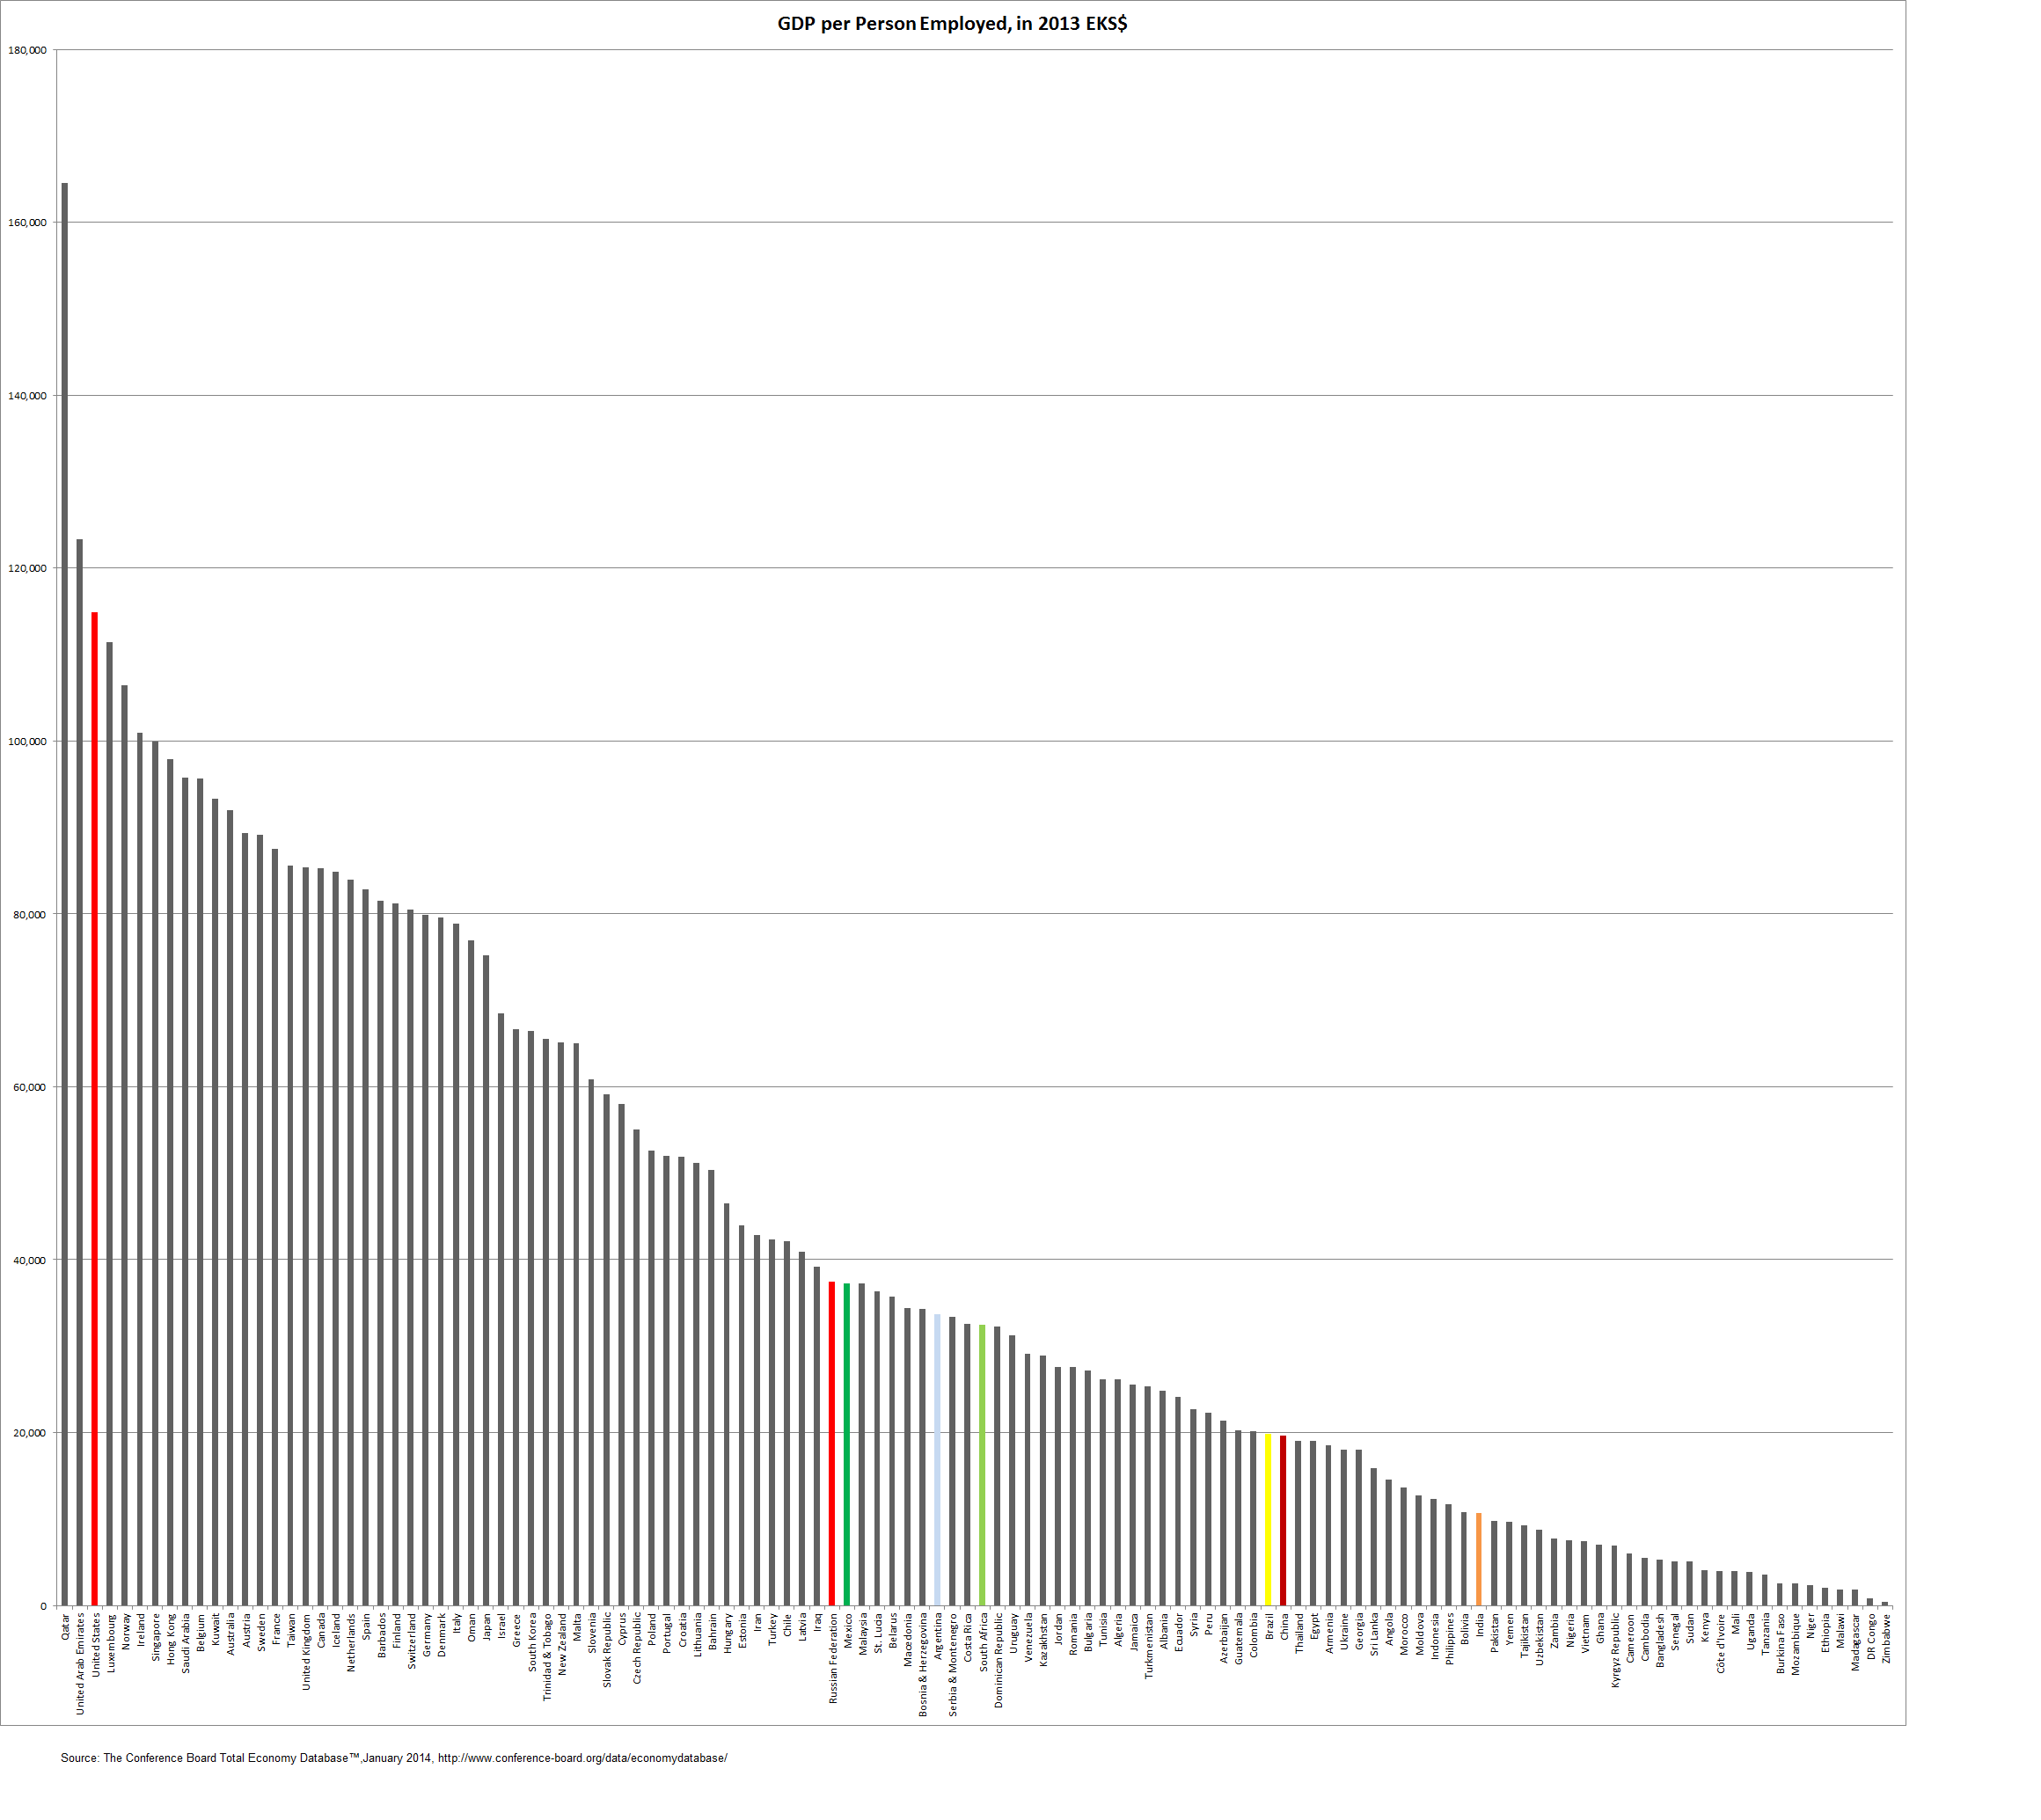
Again after a brief hiatus a new graph. Below the Conference Board measure of labor productivity.
The measure is the GDP per person employed in 2013 in dollars and adjusted to Purchasing Power Parity. The colored countries are (from left to right), the US, then Russia and Mexico, followed by Argentina and South Africa and Brazil and China. The last one is India. The range is from around 115,000 in the US to 10,000 in India, with Brazil and China close to 20,000 and the others above 30,000 and below 40,000. The database is available here. Click on the figure to enlarge.
Category: M Vernengo

