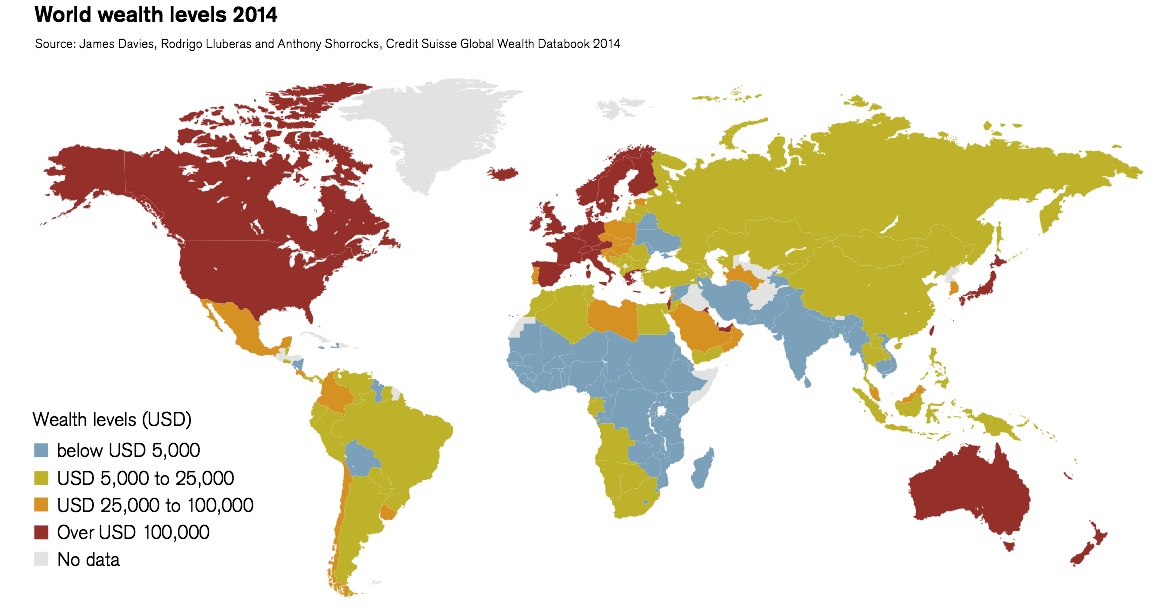
This week a Map and a graph really. Global household wealth in mid-2014 totaled USD 263 trillion, according to the new edition of the Credit Suisse Global Wealth Report (written again by Shorrocks, Davies and Lluberas; I pointed out to the previous edition before here). Map below shows the global distribution of wealth by country.
The top 1% in the US holds approximately 20% of income, and more like 33% of all wealth, as shown in the graph below.
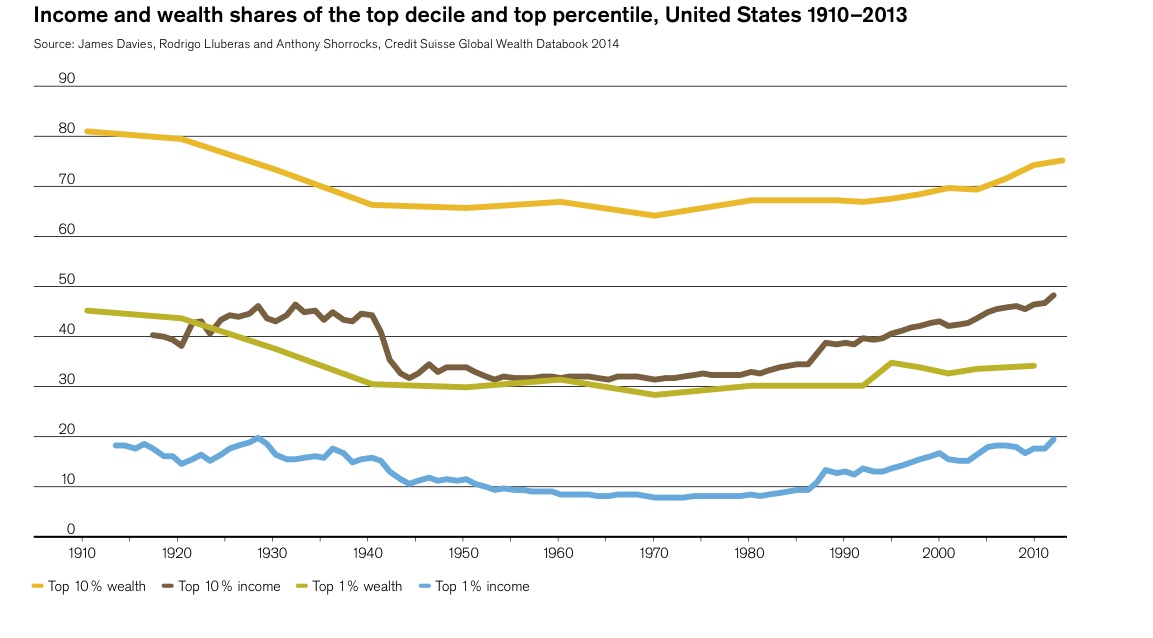
The equivalent for the top decile is 75% of wealth. Asset price dynamics is essential to understand the evolution of wealth inequality, and inheritance is central to its persistence. If you had any doubts.
Category: M Vernengo