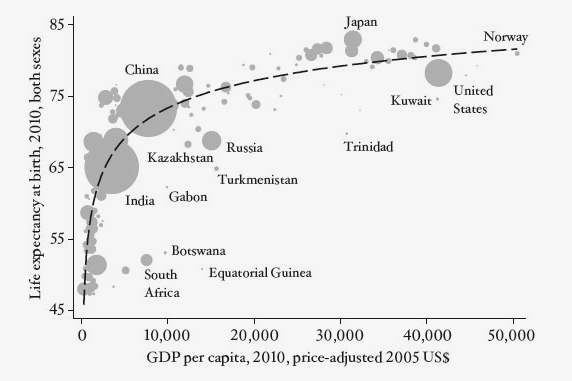
The graph (from Angus Deaton’s The Great Escape, a review here) shows the relation between GDP per capita and life expectancy at birth. It is a positive correlation, but the curve flattens out at an upper middle income level (by World Bank definition), which in this case is more or less around China (the big circle represents size of population). Basically the epidemiological break, the point at which the curve becomes flat, is the level of income at which child mortality goes down. In other words, the point at which spending in sanitation, and health prevention that reduces deaths from transmissible diseases. Not only income, but also rates of urbanization would be correlated with lower infant mortality, since in cities it’s often easier to have access to education (necessary to lead to treatment), hospitals and, hence, pre-natal care and vaccination, and more sources of treated water. From that point on most deaths are associated with chronic diseases, meaning cardiovascular ones.
PS: AIDS, in the case of some African countries, and the transition to the market, in Russia and some Soviet republics, explains why some are off the curve, so to speak.
Category: Development, Well-being