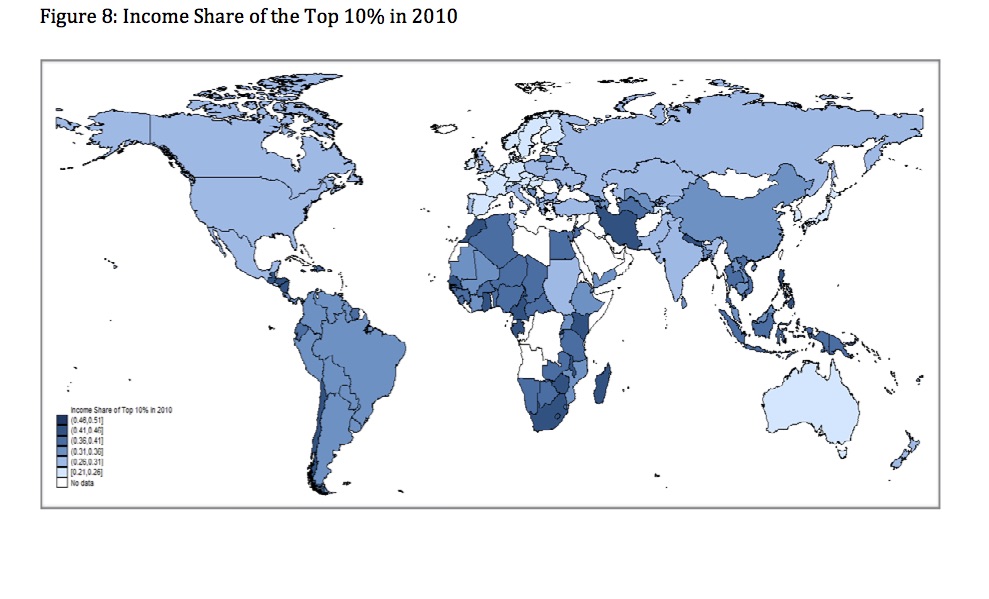
Back after a long hiatus. Below two maps (not graphs, but close enough). The first shows the income share of the top 10%. It shows a predictable picture. Western Europe is the island of equality. Note that South Asia doesn’t look terribly bad in international comparison.
The second map shows the share of population consuming less than US$ 2.5 per day measured in PPP.

As you can see in this one the picture is significantly different. India now looks more unequal than China, the Southern Cone better than the rest of South America, and Mexico worse than the US. Africa and South Asia are the worst in terms of inequality when consumption is used as a measure. Latin America looks slightly less unequal in this measure. The maps comes from the new paper by Sanjay Reddy and his co-authors available here.
Category: Uncategorized