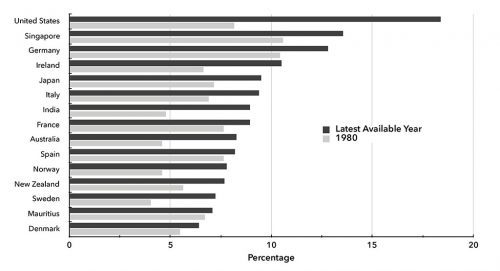
Share of National Income Going to Richest 1%
From the Monthly Review:
It is by now well known that significant and growing economic inequality is a central feature of the U.S. economy, as previous articles in Monthly Review have shown.1 However, the same is also the case for much of the rest of the world. Inequality arises in other countries for reasons similar to those in the United States, but each nation has its own history, along with widely divergent economic and political structures. Here we will look first at the most recent data on global inequality, and then at its causes and consequences.
We can compare inequality around the globe by looking at the Gini coefficient, a simple concept that allows us to track a single number whose rise or fall indicates an increase or decrease in inequality in one nation, or to compare relative levels of inequality in different countries. A Gini coefficient has a value of 0 if there is perfect equality of income or wealth. That is, if income or wealth is divided into fifths (quintiles), each one-fifth of the population (the poorest, second, middle, fourth, and richest quintiles) would receive exactly 20 percent of total income or wealth. If the coefficient has a value of 1, then one person, household, or family—depending on the type of income or wealth being compared—gets all of the income or wealth. The higher the number, the greater the inequality. Chart 1 shows this coefficient (for income) for most of the world’s rich nations, as well as for a few poor and rapidly growing economies outside of Europe and North America. Notice that the coefficient for the United States is exceeded only by that for Turkey, Mexico, Chile, Indonesia, Argentina, China, Latvia, Brazil, Colombia, and South Africa…
Read rest here
This excerpt is based on the author’s book, The Great Inequality – see here